The AI Visibility Gap: What 173 UK Local Service Websites Reveal About Getting Found by AI
Most UK local service businesses are not missing from the web. They are present, crawlable and mobile-ready. What they are missing is the answer-shaped content that AI systems read most closely. QBiz Leads AI audited 173 local service websites across four sectors and five cities against ten technical readiness signals. 120 of the 173 sites (69.4%) scored as Ready. Yet the same sites failed the answer-oriented signals most often: 69.4% had no llms.txt file, 68.2% had no FAQ content, and 67.1% gave no process or how-it-works explanation. The gap is incomplete explanation, not absence from the web.
Overall readiness across 173 sites
Distribution of readiness tiers, all-rows basis (n=173)
Two out of three sites are already Ready. The eight unclassified sites could not be fetched, so they carry no tier and are shown separately, never folded into Not Ready.
The short version
- We audited 173 UK local service business websites (plumbers, solicitors, dental practices and accountants) across London, Manchester, Birmingham, Edinburgh and Bristol.
- Each site was scored on ten binary readiness signals, summed to a 0 to 10 total, then banded: Not Ready (0 to 3), Partially Ready (4 to 6), Ready (7 to 10).
- Most sites clear the technical basics. Crawlability passed on 94.2% of sites, mobile render on 93.6%, entity consistency on 92.5%.
- Most sites miss the answer layer. The three most-failed signals are llms.txt (69.4% fail), FAQ content (68.2% fail) and process explanation (67.1% fail).
- The mean readiness score was 6.92 across all rows, sitting just below the Ready threshold of 7.
- This is a readiness audit, not a citation study. It measures whether sites carry signals that are plausibly helpful for AI systems. It does not test, and does not claim, that any site was cited, summarised or ranked by any AI tool.

The full paper, dataset and audit code are open. You can read and reproduce every figure below from the Zenodo archive, the SocArXiv preprint or the Kaggle dataset companion.
The headline numbers
What the 173-site audit found
173
UK local service websites audited across four sectors and five cities
120
of the 173 sites, or 69.4%, scored as Ready on the ten technical signals
6.92
mean readiness score across all rows, sitting just below the Ready threshold of 7
30.6%
of sites carried an llms.txt file, the single most-failed signal
QBiz Leads AI, AI Visibility Gap Report, 173-site audit (all-rows basis).
How we ran the audit
We designed a study of 200 sites: four sectors, five cities, ten websites in each of the twenty sector-city cells. The achieved sample came to 173, because some cells yielded fewer collected URLs than the target of ten. The two smallest cells were dental practices in Bristol (2 sites) and plumbers in Bristol (5 sites). We report the achieved 173 against the planned 200 rather than padding the count.
Method
How the audit was run
Plan the study
200 sites planned: four sectors, five cities, ten websites in each sector-city cell.
Read each site
An automated script requested each URL and read the returned HTML, headings, scripts and links.
Ten binary signals
Each site was scored on ten binary readiness signals, summed to a 0 to 10 total.
Group the total
Not Ready is 0 to 3, Partially Ready 4 to 6 and Ready 7 to 10 out of ten.
Each site was fetched by an automated Python script (audit_site.py) using a QBiz AI readiness user agent and a 10-second timeout. The script read the returned HTML, extracted the visible text, headings, scripts and links, then applied ten binary signal tests. It made a separate request to the root /llms.txt path. Every URL produced one JSON record.
Of the 173 sites, 165 fetched successfully and 8 returned fetch errors (seven HTTP 403 Forbidden responses and one HTTP 523), on an audit run dated 3 June 2026. A fetch error means the audit could not read the page at all, so those eight sites carry no signal scores and no readiness tier. They are kept in the dataset and reported separately rather than dropped or counted as failures. This matters for how the headline is read, and we return to it in the limitations section.
The planned 200-site design (four sectors, five cities, ten sites per cell) yielded 173 collected URLs. Of those, 165 fetched successfully and were scored against ten signals; eight returned fetch errors on the 3 June 2026 run and were kept in the dataset without a tier.
There are two calculation bases in this study, and they are never mixed inside a single figure:
- All rows (n=173): the eight fetch errors are included as unscored, tier-blank rows. This is the default basis for the headline numbers, because the errors are part of what happened.
- Successful fetches (n=165): the eight error rows are excluded. This basis reads slightly stronger.
Where a number changes depending on the basis, we state which one it uses.
Overall readiness: clustered just below the top
Across all 173 sites, the readiness scores cluster in the upper-middle of the range rather than splitting into two camps. The mean score is 6.92 across all rows and 7.25 across the 165 successful fetches. The single most common outcome was a score of 7 (44 sites), closely followed by 8 (42 sites). Only 6 sites earned a perfect 10, and only 4 sites landed in the Not Ready band.
| Tier | Score band | Sites | Share (all rows, n=173) |
|---|---|---|---|
| Ready | 7 to 10 | 120 | 69.4% |
| Partially Ready | 4 to 6 | 41 | 23.7% |
| Not Ready | 0 to 3 | 4 | 2.3% |
| Audit error (unclassified) | fetch failed | 8 | 4.6% |
| Total | 173 | 100% |
On the successful-only basis, the Ready share rises to 72.7% and Partially Ready to 24.8%.
How the 173 readiness scores spread
Count of sites by total score (0 to 10), all-rows basis; the modal band is 7 and 8
Scores 7 and 8 are the modal band (86 sites between them). The eight sites at score 0 are the fetch errors, which carry a total of 0 rather than a genuine low score. Genuine failure is rare: only 4 sites scored 3 or below.
Read the distribution plainly. Two out of three sites are already Ready. Almost a quarter sit one or two signals short of the threshold, in the Partially Ready band. Genuine failure, where a site misses most of even the technical basics, is rare: 4 sites out of 173. The story worth reading is what the large, competent middle-and-upper group is consistently leaving out.
The ten signals: strong basics, weak answers
Rank the ten signals by how often they pass and a clean split appears. The signals that pass most are technical and identity basics. The signals that fail most are answer-oriented.
Signal split
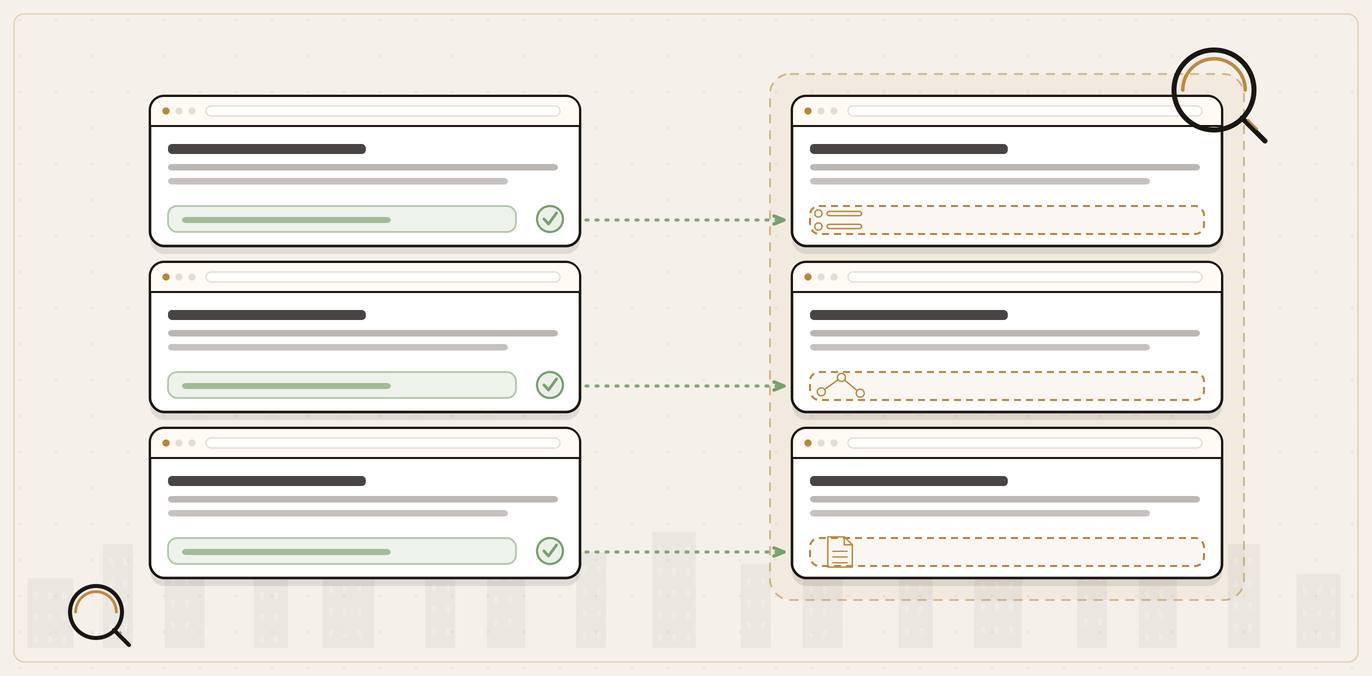
Does the site carry answer-shaped content?
Ask
Does the page carry FAQ, process and llms.txt content?
It stands out from the field
Few sites do: process explanation reached just 32.9%, FAQ content 31.8% and llms.txt 30.6% across the 173 sites.
It looks like most of the field
The basics still pass, with crawlability at 94.2%, mobile render 93.6% and entity consistency 92.5%, so the site is present but under-explained.
| Signal | Pass (all rows) | Pass % (all rows) | Fail % (all rows) |
|---|---|---|---|
| Crawlability | 163 | 94.2% | 5.8% |
| Mobile render | 162 | 93.6% | 6.4% |
| Entity consistency | 160 | 92.5% | 7.5% |
| Internal linking | 148 | 85.5% | 14.5% |
| Service definitions | 139 | 80.3% | 19.7% |
| Schema markup | 138 | 79.8% | 20.2% |
| H1/H2 heading structure | 122 | 70.5% | 29.5% |
| Process explanation | 57 | 32.9% | 67.1% |
| FAQ content | 55 | 31.8% | 68.2% |
| llms.txt present | 53 | 30.6% | 69.4% |
The strong three are the plumbing of a working website. Crawlability, measured here as visible text over 500 characters, passed on 94.2% of sites. A viewport meta tag, our proxy for mobile rendering, was present on 93.6%. Entity consistency, meaning both a phone number and an address pattern on the page, passed on 92.5%. Nearly every site a customer or a machine reaches has readable text, renders on a phone, and states who and where the business is.
The weak three are where the site explains itself. llms.txt, a root-level file that gives AI crawlers a plain-text guide to a site, was present on only 30.6% of sites, making it the single most-failed signal. FAQ content, any recognised question-and-answer block, was found on only 31.8%. Process explanation, any "how it works", "our process" or "what to expect" language, appeared on only 32.9%. Roughly two in three sites give a customer no direct answers, no described process, and no machine-readable guide.
The middle tier fills in the picture. Internal linking (five or more same-site links) passed on 85.5%. Service definitions, phrases like "what we do" or "we provide", passed on 80.3%. Schema markup, a JSON-LD block, passed on 79.8%. Heading structure, at least one H1 and two H2s, passed on 70.5%. These are common but not universal, and each represents a real slice of sites leaving structure on the table.
The pattern holds on the successful-only basis too: crawlability 98.8%, mobile render 98.2% and entity consistency 97.0% at the top; llms.txt 32.1%, FAQ 33.3% and process explanation 34.5% at the bottom.
The paper states the finding in one line: the AI visibility gap is less about complete absence from the web and more about incomplete explanation. Sites have the foundations. Far fewer carry the answer-ready content that helps a reader, or a machine, understand what the business does, how it works, and how to choose it. This is the layer that answer engine optimisation is built around.
A note on llms.txt specifically. Its 30.6% pass rate makes it uncommon enough to stand out in this dataset, but we do not claim it is required for AI visibility. Treat it as an emerging signal: rare enough to be a differentiator today, not yet a settled baseline. If you want the background, we cover what an llms.txt file is and does separately.
By sector: the differences are real but not extreme
Four sectors, four readiness profiles. The differences hold up in the data, and they are modest.
| Sector | Sites | Mean (all rows) | Ready | Partially Ready | Not Ready | Errors | Ready share (all rows) |
|---|---|---|---|---|---|---|---|
| Solicitors | 46 | 7.13 | 36 | 8 | 0 | 2 | 78.3% |
| Dental practices | 38 | 7.03 | 31 | 3 | 2 | 2 | 81.6% |
| Accountants | 46 | 6.85 | 27 | 17 | 1 | 1 | 58.7% |
| Plumbers | 43 | 6.67 | 26 | 13 | 1 | 3 | 60.5% |
Mean readiness score (all rows)
Ready share (all rows)
Two metrics, two orders: solicitors lead on mean score (left, slate), while dental practices lead on Ready share (right, gold). Naming the metric matters, because the two disagree on which sector is "best".
"Best" and "worst" depend on which metric you name, so name it.
- Solicitors lead on mean score (7.13). Legal sites scored highest on average and had no Not Ready sites at all.
- Dental practices lead on Ready share (81.6%). More than four in five dental sites reached the Ready band, the highest proportion of any sector, even though dental had the lowest mean of the top group.
- Plumbers have the lowest mean (6.67). Plumbing sites scored lowest on average, held down in part by the sector's three fetch errors and a sizeable Partially Ready group.
- Accountants have the lowest Ready share (58.7%). Fewer than three in five accountancy sites reached Ready. The paper explains this as a large Partially Ready group of 17 sites that passed the core technical checks but missed enough content or structure signals to stay below the threshold.
On the successful-only basis the sector means compress further: solicitors 7.45, dental 7.42, plumbers 7.17, accountants 7.00. The gap between the strongest and weakest sector is under half a point. Sector matters, but it is not the main story. Every sector shows the same shape: solid basics, thin answer content.
By city: strong signals, but read them as descriptive
Five cities, and unlike the sector cut, city results are more sensitive to fetch errors and achieved sample sizes. Treat these as comparisons within this dataset, not as claims about those local markets.
| City | Sites | Mean (all rows) | Mean (successful) | Ready | Partially Ready | Not Ready | Errors | Ready share (all rows) |
|---|---|---|---|---|---|---|---|---|
| Manchester | 40 | 7.50 | 7.50 | 35 | 4 | 1 | 0 | 87.5% |
| Birmingham | 33 | 7.18 | 7.18 | 21 | 12 | 0 | 0 | 63.6% |
| Bristol | 22 | 7.05 | 7.05 | 14 | 8 | 0 | 0 | 63.6% |
| London | 40 | 6.67 | 7.63 | 28 | 6 | 1 | 5 | 70.0% |
| Edinburgh | 38 | 6.26 | 6.80 | 22 | 11 | 2 | 3 | 57.9% |
- Manchester is strongest on the all-rows mean (7.50), with an 87.5% Ready share and no fetch errors. Its all-rows and successful means are identical, because nothing failed to fetch.
- Edinburgh is weakest, and stays weakest even after errors are excluded: its successful-only mean of 6.80 is still the lowest of the five.
- London shows why the two bases matter. Its all-rows mean of 6.67 is dragged down by five fetch errors, the most of any city. On the successful-only basis, London's mean jumps to 7.63, the highest of any city. The same city looks mid-table on one basis and top of the table on the other, purely because of how the eight unfetchable sites are treated.
- Bristol needs a caveat. Its achieved sample of 22 was well below plan, with only 2 dental practices. Read Bristol as descriptive of the sites we could collect, not as a market estimate.
London mean, all rows (n=40)
includes 5 unfetchable sites scored 0
London mean, successful only (n=35)
the 5 unfetchable sites excluded
Same city, same pages: the figure moves from mid-table to top of the table only because of how the five unfetchable London sites are treated, not because anything on the pages changed. It is the clearest illustration of why this study reports two calculation bases.
City ranking is the least stable cut in the study. The signal-level story, strong basics and weak answers, is what carries across every city.
What each tier looks like in practice
A tier is a count of passed signals, but it helps to see the shape of a typical site in each band. The profiles below are drawn from real audited rows. We describe the signal pattern rather than naming any business.
8 / 10
A representative Ready plumbing site in London. Passes schema, headings, service definitions, entity, crawlability, internal links, mobile and llms.txt; misses only FAQ and process. One answer-layer edit from the top band.
6 / 10
A Partially Ready plumbing site in London. Passes headings, service definitions, entity, crawlability, internal links and mobile; misses schema, FAQ, process and llms.txt. Foundations in place, explanation absent.
3 / 10
A Not Ready accountancy site in London. Passes only FAQ, crawlability and mobile; misses schema, headings, service definitions, process, entity and internal links. A genuinely thin presence, only 4 sites landed here.
no tier
One of the 8 sites that could not be fetched (7x HTTP 403, 1x HTTP 523). No signals scored, no tier assigned. Not the same as Not Ready: this page could not be read at all.
Signals 1 to 10, in the order: schema, FAQ, headings, service definitions, process, entity, crawlability, internal links, mobile, llms.txt.
Ready (7 to 10 signals). A Ready site clears the technical basics and usually carries schema and service-definition language too. It is typically missing only a couple of the harder answer signals. One Ready plumbing site in London scored 8 out of 10: it passed schema, headings, service definitions, entity consistency, crawlability, internal linking, mobile render and llms.txt, and fell short on only two signals, FAQ content and process explanation. That is the representative Ready story: competent, structured, and one answer-layer edit away from the top band.
Partially Ready (4 to 6 signals). A Partially Ready site has the technical basics but misses most of the answer-oriented layer, and sometimes schema or headings too. One such plumbing site in London scored 6: it passed headings, service definitions, entity consistency, crawlability, internal linking and mobile render, but missed schema, FAQ, process explanation and llms.txt. The foundations are in place, while the explanation and structure are absent.
Not Ready (0 to 3 signals). A Not Ready site fails many of the technical basics, not just the answer content. This band is rare, at 4 sites. One accountancy site in London scored 3: it passed only FAQ content, crawlability and mobile render, missing schema, headings, service definitions, process explanation, entity consistency and internal linking. A Not Ready site has a genuinely thin web presence, which is a different problem from the incomplete-explanation gap that defines the large middle group.
Audit error (8 sites). These sites could not be fetched, so no signals were scored. They carry an empty score record, a total of 0, and no readiness tier. They are not the same as Not Ready. A Not Ready site was read and scored poorly; an error site could not be read at all. Grouping the two together would misrepresent both.
Methodology and limitations, in one place
The findings above are only as good as the method behind them, so here is what this study is and is not, gathered in one section rather than scattered through the piece.
This is a readiness audit, not a citation study. It measures whether a site carries ten signals that are plausibly helpful for AI systems reading and understanding a page. It does not test whether any site was actually cited, summarised or ranked by ChatGPT, Google AI Overviews, Perplexity or any other system. We treat the signals as relevant, not as necessary or proven. Nowhere does this study show, or claim, that any single signal causes a citation. How AI engines pick their sources is a separate and more complex question than the one measured here.
It is descriptive, not representative. 173 sites is not a statistical sample of all UK local service businesses. The sector and city breakdowns are patterns within this dataset, not population estimates. A different 173 sites could shift the numbers.
The sample was relaxed from 200 to 173. This was because some sector-city cells yielded fewer collected URLs than the target of ten, not because of bot detection. Some cells are small, notably dental practices in Bristol (2 sites) and plumbers in Bristol (5 sites). Small cells make their city and sector cuts noisier.
The scope is single-country. All five cities are in the UK. Nothing here supports a cross-country claim.
Eight sites could not be fetched. Seven returned HTTP 403 and one returned HTTP 523. A failed fetch does not prove a site is unavailable to all users or all crawlers. It shows the page was not accessible to this specific automated audit configuration, which may reflect bot protection, server configuration, a temporary failure or site availability on the day.
These eight rows are kept separate from the scored tiers, and the study shows exactly how the headline moves under each treatment: if the errors were excluded, the Ready share rises from 69.4% to 72.7%; if they were counted as Not Ready, the Not Ready group would grow from 4 sites to 12. Whether a page can be read by an automated tool at all is itself a real readiness question, which we cover in what happens when AI cannot read your website.
The signals are proxies. A viewport tag is a proxy for mobile rendering, not proof of it. Visible-text length is a proxy for crawlability. Phrase matching for FAQ, process and service language can miss equivalent wording, and can occasionally catch a weak or incidental match. Entity consistency checks for a phone and an address pattern, not full cross-directory consistency. These trade-offs keep the method simple and reproducible, and they set a ceiling on how finely any single signal should be read.
Two calculation bases exist. Headline figures differ on the all-rows (173) basis versus the successful-only (165) basis, and the treatment of the eight error rows materially changes the Ready and Not Ready figures. Every figure in this report states its basis.
Two disclosure notes from the independent fact-check. First, percentages are rounded to one decimal place and means to two, under round-half-even; the London all-rows mean is exactly 6.675, reported as 6.67. Second, only the 165 successfully fetched sites were scored against all ten signals. The eight error rows have empty score records and no tier, so it would be wrong to say all 173 sites were assessed against all ten signals. The correct wording is that successfully fetched sites were assessed against ten binary signals, and error rows were retained and reported separately.
The paper's own numbers were independently recalculated from the raw results by a separate fact-check pass: 78 grouped numeric and method claims passed, with two wording flags and no numeric corrections. The full method, the per-cell counts, the raw per-site data and the audit code are all in the open archive.
What this means if you run a local service business
Two out of three audited sites are already Ready on the technical basics. If your site is crawlable, renders on a phone, and states your phone number and address clearly, you are likely in that group. The differentiator in this dataset was the answer layer, the content most sites skip, rather than the technical plumbing.
Start where the audited sites fell short most often:
Where to start
The fixes the audited sites missed most
Add a genuine FAQ.Write the questions a customer asks before booking and answer each one directly in plain text.
Explain your process.Describe what happens from first contact to finished job, in clear steps.
Consider an llms.txt file.An emerging signal, not a requirement, but uncommon enough that adding one sets you apart today.
Check your structure.A clean H1-and-two-H2 heading structure, schema markup and clear service-definition language.
- Add a genuine FAQ. Two in three sites had none. Write out the questions a customer actually asks before booking, and answer each one directly in plain text. This is the same content that helps a person decide and gives a machine something clean to read.
- Explain your process. Two in three sites had no "how it works", "what to expect" or "our approach" content. Describe what happens from first contact to finished job, in steps.
- Consider an llms.txt file. Seven in ten sites had none. It is an emerging signal, not a requirement, but it is uncommon enough that adding one sets you apart in this field today.
- Check your structure. Nearly one in three sites lacked a clean H1-and-two-H2 heading structure, and one in five had no schema markup or no clear service-definition language. These are quick, well-understood fixes.
Run a rough version of this audit on your own site in a few minutes. Open your homepage and a main service page, and check whether a first-time visitor could find: a direct answer to their most common question, a described process, your service list in plain words, and your phone and address on the page.
Then check whether your site returns a file at yourdomain.co.uk/llms.txt. If several of those are missing, you are in the same large group as most of the sites we audited: present and competent, but under-explained. The fix is content, not a rebuild. For the small-business view of where these signals sit, see our guide to answer engine optimisation for local businesses.
Get your AI Visibility audit →
Frequently asked questions
How many UK local service websites did QBiz Leads AI audit, and how were they chosen?
QBiz Leads AI audited 173 UK local service business websites. The study was designed around 200 sites: four sectors (plumbers, solicitors, dental practices and accountants) across five cities (London, Manchester, Birmingham, Edinburgh and Bristol), with ten sites in each sector-city cell. The achieved sample was 173 because some cells yielded fewer collected URLs than the target of ten.
What share of the audited sites were AI-ready?
120 of the 173 sites, or 69.4%, scored as Ready (7 to 10 signals out of 10) on the all-rows basis. On the successful-only basis, which excludes the 8 sites that could not be fetched, the Ready share is 72.7%. A further 23.7% were Partially Ready and 2.3% were Not Ready.
What is the main finding of the AI Visibility Gap Report?
The main finding is that the AI visibility gap is less about complete absence from the web and more about incomplete explanation. Most audited sites passed the technical basics (crawlability 94.2%, mobile render 93.6%, entity consistency 92.5%) but failed the answer-oriented signals most often (llms.txt 69.4% fail, FAQ content 68.2% fail, process explanation 67.1% fail).
Which signals did local service websites fail most often?
The three most-failed signals were all answer-oriented. llms.txt was absent on 69.4% of sites, FAQ content was absent on 68.2%, and process or how-it-works explanation was absent on 67.1%. These were far more common failures than any technical signal.
Which signals did local service websites pass most often?
The three most-passed signals were technical and identity basics. Crawlability passed on 94.2% of sites, mobile render on 93.6%, and entity consistency (a phone number plus an address pattern on the page) on 92.5%.
Which sector performed best in the audit?
It depends on the metric. Solicitors had the highest mean score (7.13 on the all-rows basis). Dental practices had the highest Ready share (81.6%, or 31 of 38 sites). Both statements are correct; they measure different things.
Which sector performed worst in the audit?
Again it depends on the metric. Plumbers had the lowest mean score (6.67). Accountants had the lowest Ready share (58.7%), because a large group of 17 accountancy sites were Partially Ready, passing the technical checks but missing enough content or structure signals to reach the Ready threshold.
Which city scored highest and lowest?
Manchester scored highest on the all-rows mean (7.50) with an 87.5% Ready share and no fetch errors. Edinburgh scored lowest (all-rows mean 6.26), and remained lowest even after excluding fetch errors (successful mean 6.80). City figures are more affected by fetch errors and sample size, so they should be read as descriptive of this dataset rather than as market rankings.
Why does London look mid-table on one measure but top on another?
London had five fetch errors, the most of any city, which pulled its all-rows mean down to 6.67. When those unfetchable sites are excluded, London's successful-only mean is 7.63, the highest of any city. Nothing about the pages changed; only the treatment of the five unfetchable sites did. It is the clearest example of why this study reports two calculation bases.
What are the ten signals the audit measured?
The ten binary signals are: schema markup, FAQ content, H1/H2 heading structure, service definitions, process explanation, entity consistency (phone plus address), crawlability (visible text over 500 characters), internal linking (at least five internal links), mobile render (a viewport meta tag) and an llms.txt file returning HTTP 200. Each signal scored 1 if detected and 0 if not, summed to a 0 to 10 total.
Does a Ready score mean an AI system will cite or recommend the site?
No. This is a technical readiness audit, not a citation study. It measures whether a site carries signals that are plausibly helpful for AI systems, not whether any site was actually cited, summarised or ranked by any AI tool. The signals are treated as relevant, not as required or proven predictors of a citation.
Why is the sample 173 sites instead of the planned 200?
The sample was relaxed from 200 to 173 because some sector-city cells contained fewer collected URLs than the target of ten. The two smallest cells were dental practices in Bristol (2 sites) and plumbers in Bristol (5 sites). This is a collection outcome, not a result of bot detection.
What happened to the 8 sites that returned errors?
Eight sites could not be fetched: seven returned HTTP 403 and one returned HTTP 523, on an audit run dated 3 June 2026. Because the pages could not be read, no signals were scored, so those sites carry no readiness tier. They were kept in the dataset and reported separately, not dropped and not counted as Not Ready. If they were excluded, the Ready share would rise to 72.7%; if they were counted as Not Ready, the Not Ready group would grow from 4 sites to 12.
Can I read the full data and reproduce these numbers?
Yes. The full paper, the raw per-site dataset and the audit code are openly published. The archive and DOI are on Zenodo (https://zenodo.org/records/21182318), the preprint is on SocArXiv (https://osf.io/preprints/socarxiv/dz9rg_v1), and the dataset companion is on Kaggle (https://www.kaggle.com/dsv/18044594). Every figure in this report traces to that source.
About this research
This report summarises the AI Visibility Gap Report 2026 (version 2.0), a technical readiness audit of 173 UK local service business websites, published by QBiz Leads AI under a CC BY 4.0 licence on 14 June 2026.
Author: Eddie Eastwood, Founder, QBiz Leads AI. ORCID: 0009-0008-3399-9443.
Cite this work:
Eastwood, E. (2026). AI Visibility Gap Report 2026 (2.0). QBiz Leads AI. Preprint: https://osf.io/preprints/socarxiv/dz9rg_v1. Archive + DOI: https://doi.org/10.5281/zenodo.21182318. Dataset companion: https://doi.org/10.34740/kaggle/dsv/18044594
Sources
- [1] Eastwood, E. (2026). AI Visibility Gap Report 2026 (2.0), Zenodo archive (full PDF, dataset and audit code), DOI 10.5281/zenodo.21182318: https://zenodo.org/records/21182318
- [2] Eastwood, E. (2026). AI Visibility Gap Report 2026, SocArXiv preprint: https://osf.io/preprints/socarxiv/dz9rg_v1
- [3] Eastwood, E. (2026). AI Visibility Gap Report 2026, Kaggle dataset and code companion, DOI 10.34740/kaggle/dsv/18044594: https://www.kaggle.com/dsv/18044594
Leave a comment
Thoughts on this post? Leave a comment below. Comments are moderated before they appear, so yours will not show on the page straight away.
Your email is used only to contact you about your comment if needed — it is never published.
Comments
No comments yet. Be the first to leave one above.